Canada has no single minimum wage. Each province and territory sets its own, and in 2026 the general adult rate ranges from $15.00 an hour in Alberta to $20.17 an hour in Nunavut. The federal minimum wage is $18.15 an hour, but it only covers workers in federally regulated industries like banks, airlines, and telecom.
That patchwork of 14 different rates, effective dates, and change schedules is hard to keep straight, especially when several rates move on the same October or April morning. This page pulls every current rate together in one place, then goes further than a rate table: how each rate has changed over the last decade, what is scheduled to rise in 2026, how the rates are set, and how far a full-time minimum-wage paycheque actually stretches against the cost of living. All figures are current as of September 2026 and sourced to each government's own pages.
Citation Policy: These minimum wage figures, tables, and comparisons are free to reuse, including for commercial and editorial work. If they help your article, report, or tool, please credit Bree with a link back to this page so other readers can find the source data.
Key Takeaways
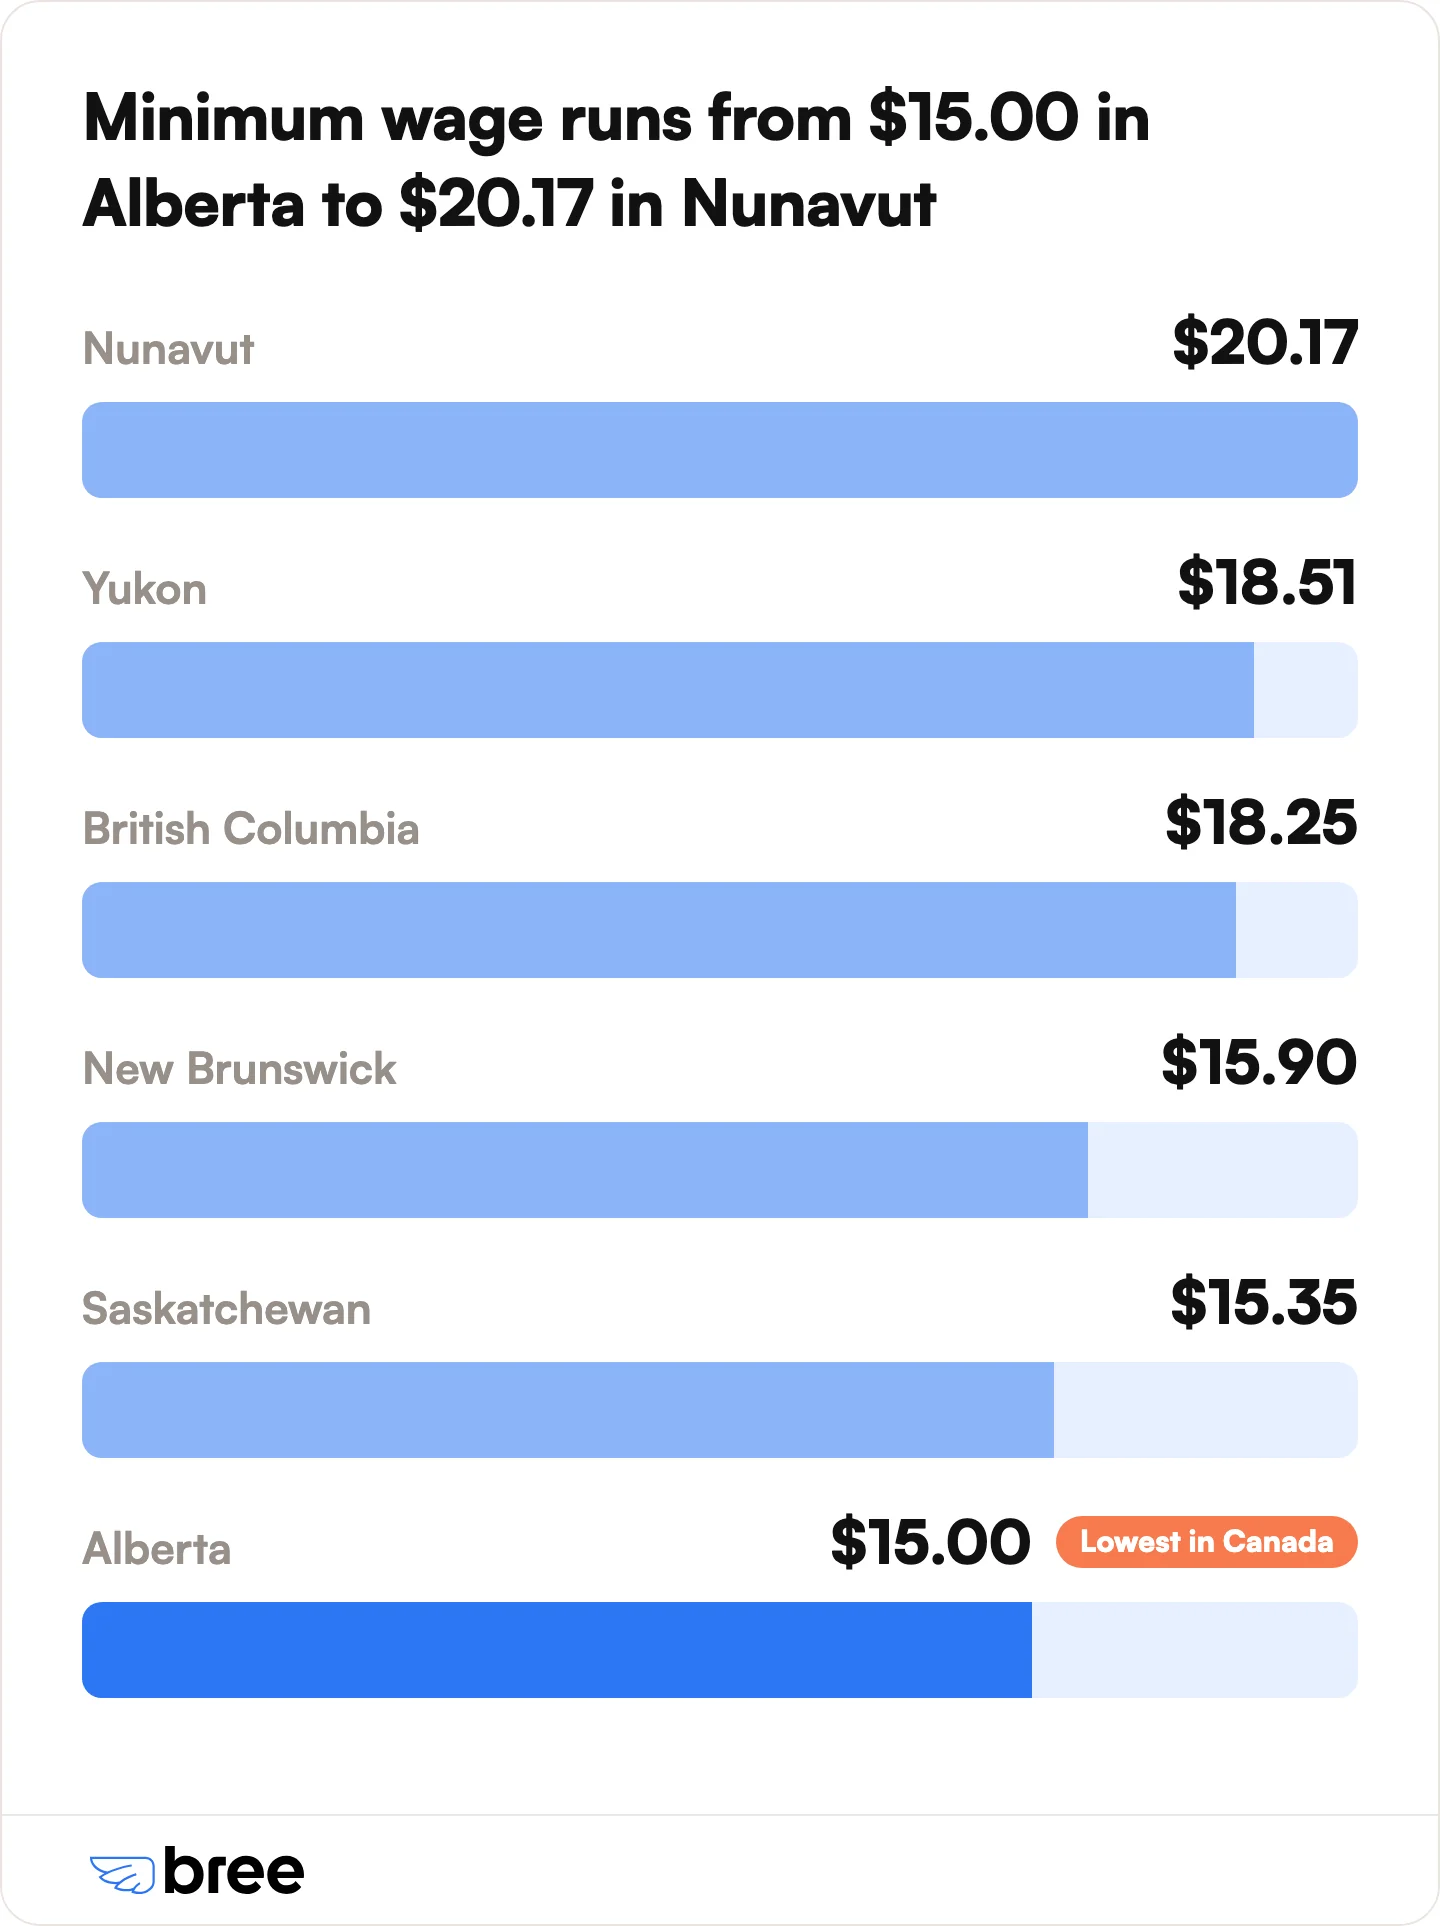
- Nunavut has the highest minimum wage in Canada at $20.17 an hour (effective September 1, 2026). Among the provinces, British Columbia is highest at $18.25 an hour.
- Alberta has the lowest minimum wage in Canada at $15.00 an hour, unchanged since October 2018.
- The federal minimum wage is $18.15 an hour (effective April 1, 2026) and applies only to federally regulated sectors, not to most workers.
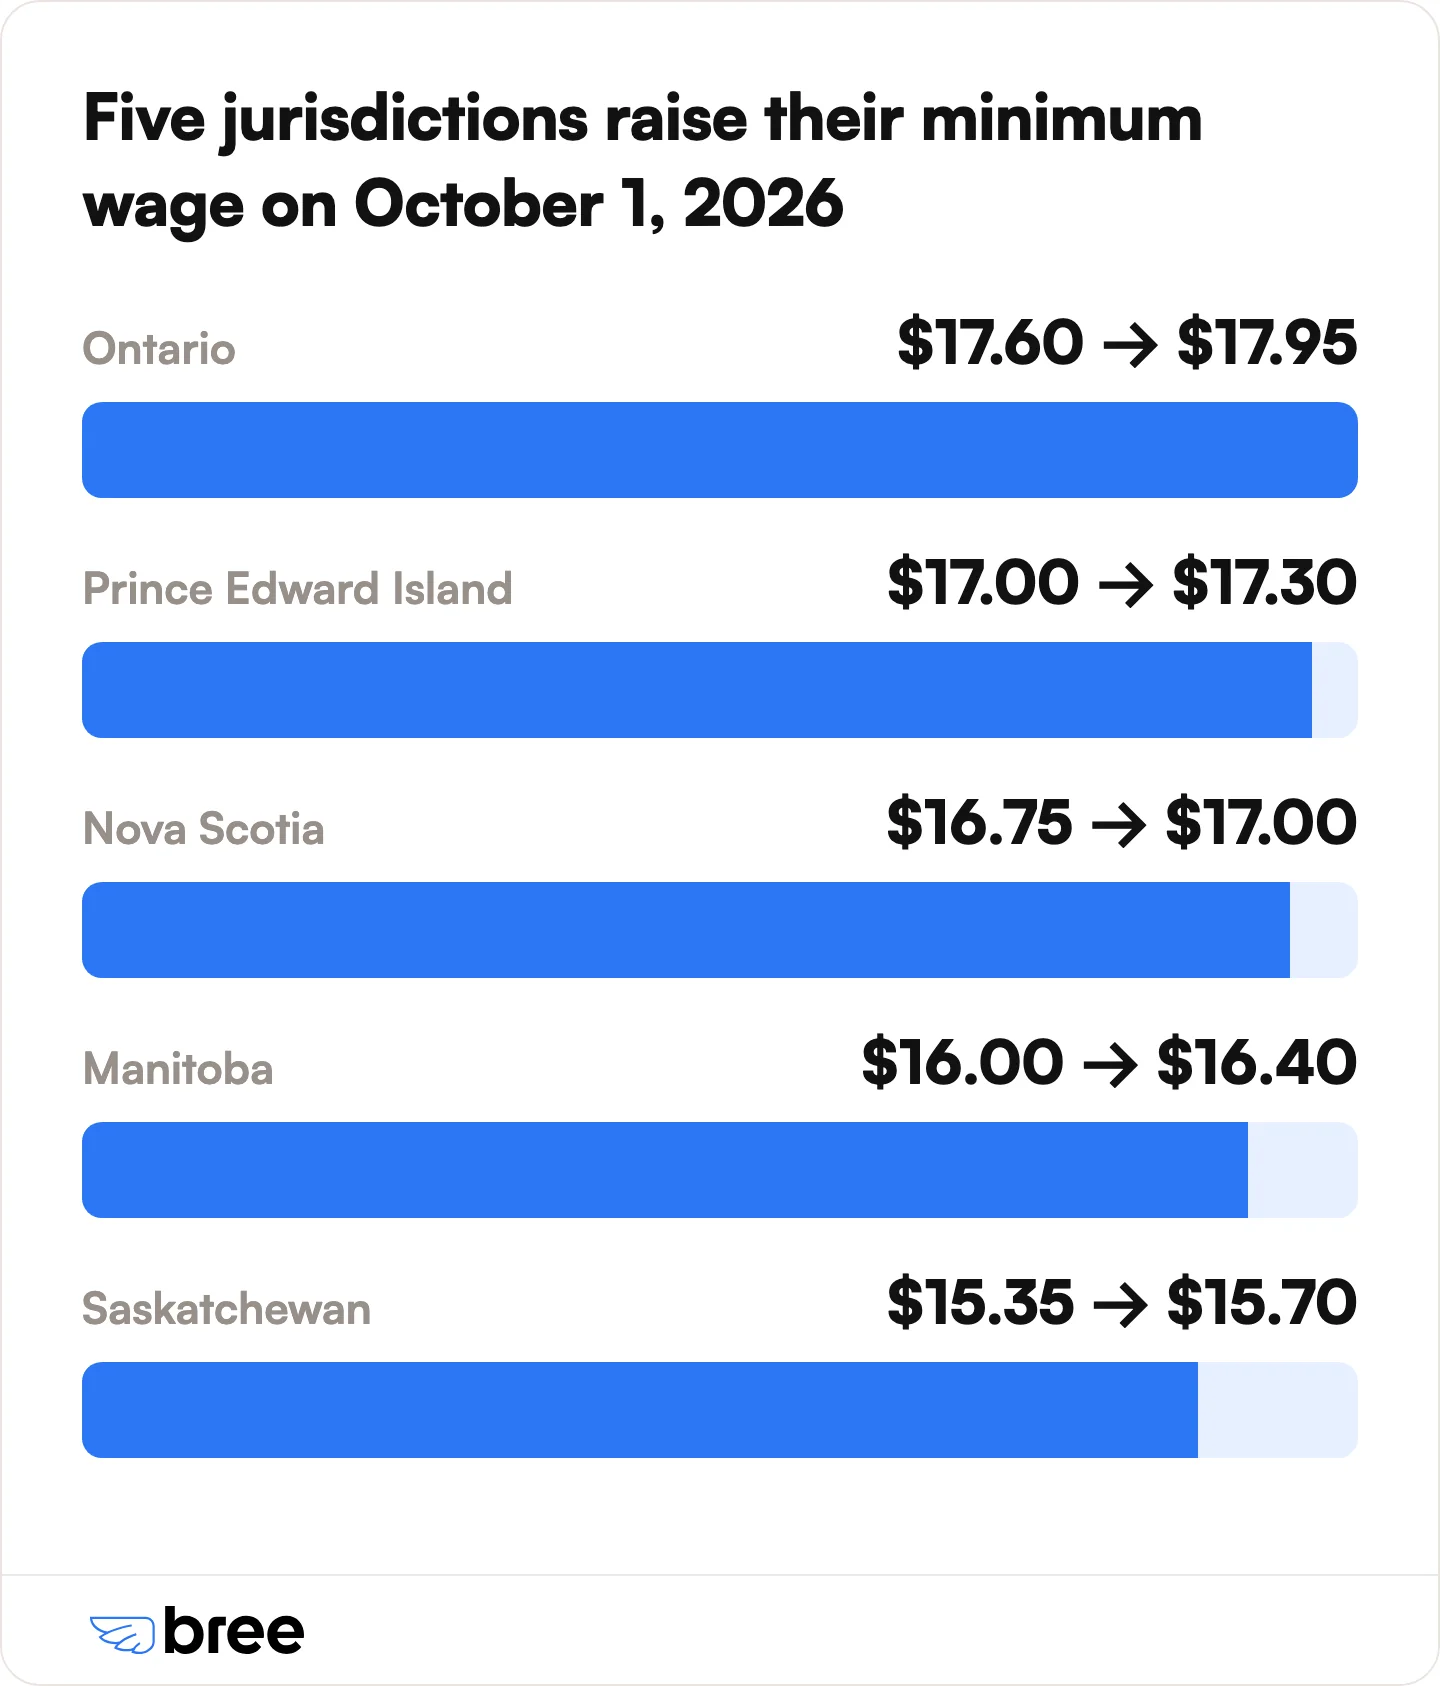
- Five jurisdictions raise their minimum wage on October 1, 2026: Ontario, Manitoba, Nova Scotia, Prince Edward Island, and Saskatchewan.
- Full-time minimum wage pays roughly $31,200 to $41,954 a year before tax, depending on the province.
- Most provinces and the federal government now index minimum wage to inflation. Alberta is the main exception.
- The living wage in Metro Vancouver is $27.85 an hour, about $10 above British Columbia's minimum.
Minimum Wage by Province and Territory in 2026
The general minimum wage in Canada ranges from $15.00 an hour (Alberta) to $20.17 an hour (Nunavut) as of September 2026. Nunavut is the only jurisdiction above $20. British Columbia leads the provinces at $18.25, and Alberta and Saskatchewan sit at the bottom.
Sources: each jurisdiction's employment-standards authority, including the Government of Ontario, Government of British Columbia, Government of Alberta, Government of Saskatchewan, Government of Manitoba, Government of Nova Scotia, Government of Prince Edward Island, Government of Newfoundland and Labrador, Government of the Northwest Territories, and Government of Nunavut. The federal rate is from Employment and Social Development Canada. Quebec, New Brunswick, and Yukon rates are confirmed against ESDC's current and forthcoming rates table.
How Canada's Minimum Wage Has Changed Over Time
Minimum wage has risen fast in most large provinces over the past decade, while Alberta has stood still. Based on the government's rate history, Ontario's minimum wage rose about 56% between 2015 and 2026, from $11.25 to $17.60, and British Columbia's rose about 75%, from $10.45 to $18.25. Alberta's climbed 34%, from $11.20 to $15.00 by October 2018, then froze, and it has not moved since.
How this table was built: each column is that jurisdiction's general adult rate on the listed effective date, taken from the Government of Canada's minimum wage database, which records rates back to 1965. Rates change on different dates in each province, so a value holds until the next increase.
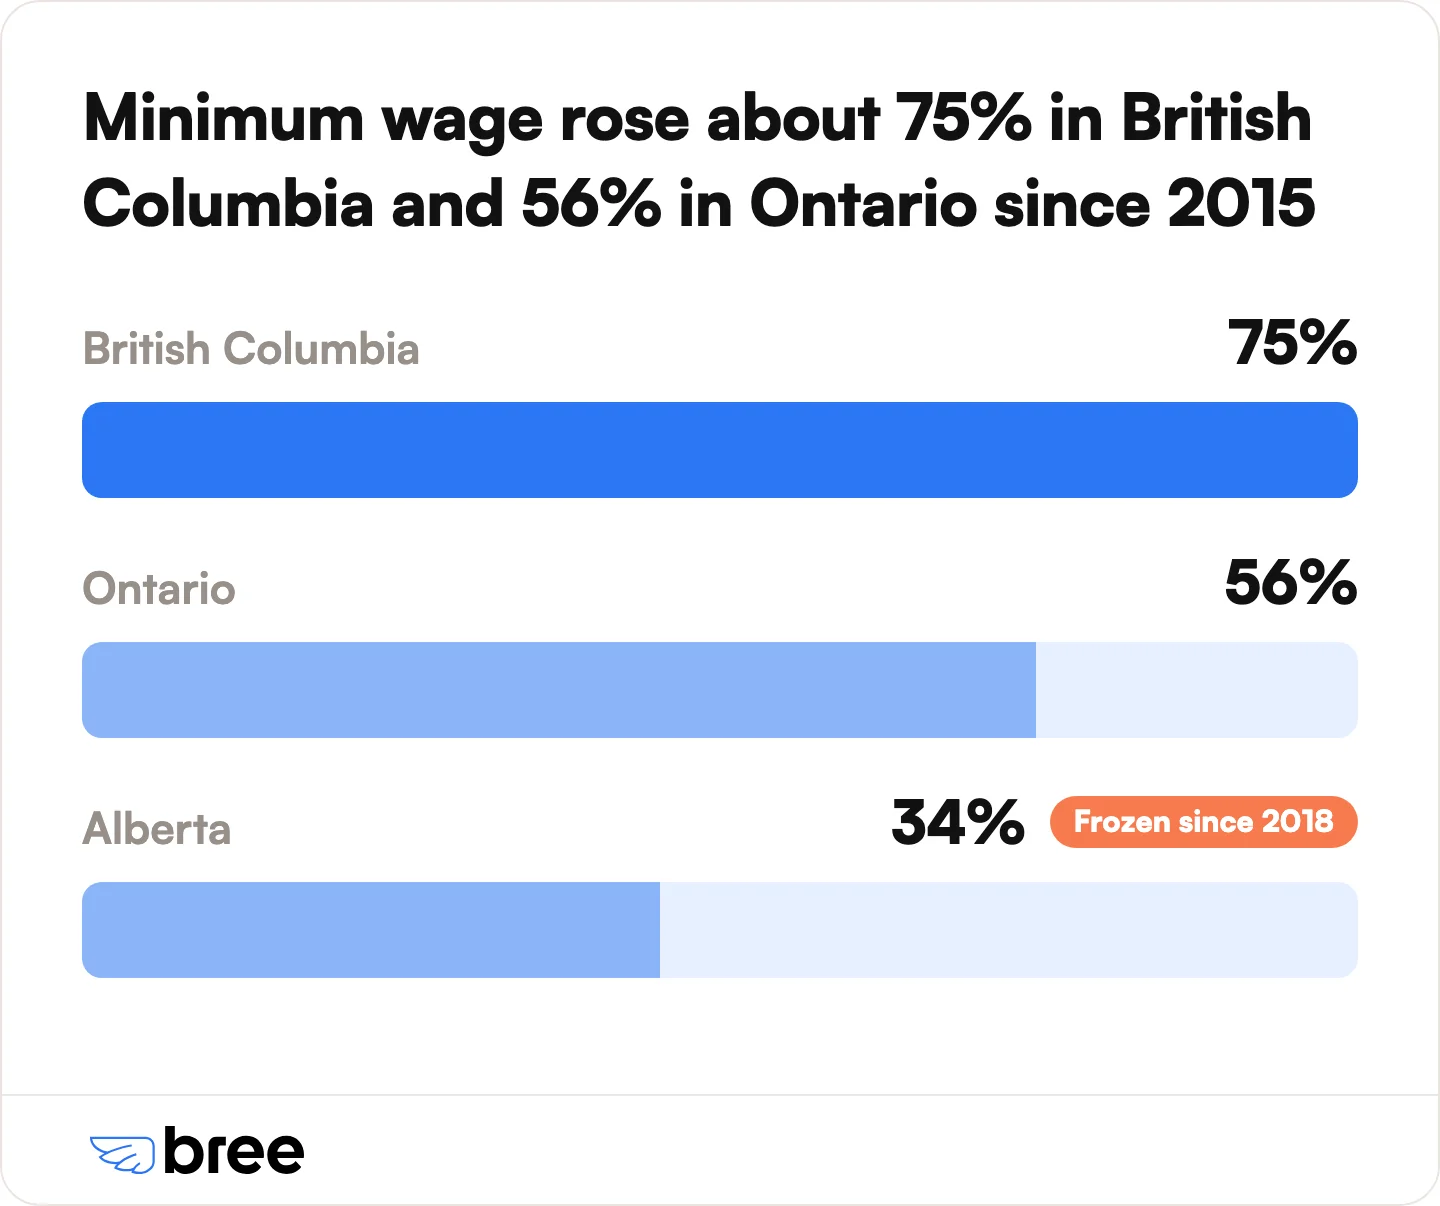
Two facts stand out from the history. Canada had no federal minimum wage between 1996 and 2021. For 25 years the federal rate simply pointed to whichever province a worker was in. Ottawa reinstated a standalone federal minimum of $15.00 an hour on December 29, 2021, and tied it to inflation. And Alberta was the first Canadian province to reach $15.00 an hour, back in October 2018, before the freeze that has left it at the bottom of the table ever since. Ontario's rate barely moved from 2018 to 2021, held down by a legislated freeze that also suspended its planned inflation indexing until 2022.
Minimum Wage Increases Coming in 2026 and 2027
Five jurisdictions raise their minimum wage on October 1, 2026: Ontario, Manitoba, Nova Scotia, Prince Edward Island, and Saskatchewan all adjust on the same date, which is a common change point alongside April 1. Prince Edward Island then has a further increase already scheduled for April 1, 2027.
Beyond these, the federal minimum wage adjusts again around April 1, 2027, with the amount set by inflation and announced closer to the date. Because most provinces now index to the Consumer Price Index, more increases are effectively locked in even when the exact figure has not been published yet, as the Government of Ontario and Government of Manitoba both confirm on their employment-standards pages.
Which Provinces Tie Minimum Wage to Inflation
Most provinces and the federal government now index minimum wage to the Consumer Price Index (CPI), so it adjusts automatically each year. Alberta is the main exception: its rate is set manually and has been frozen since 2018. Indexing is why so many rates move by a few cents each spring or fall rather than in large jumps.
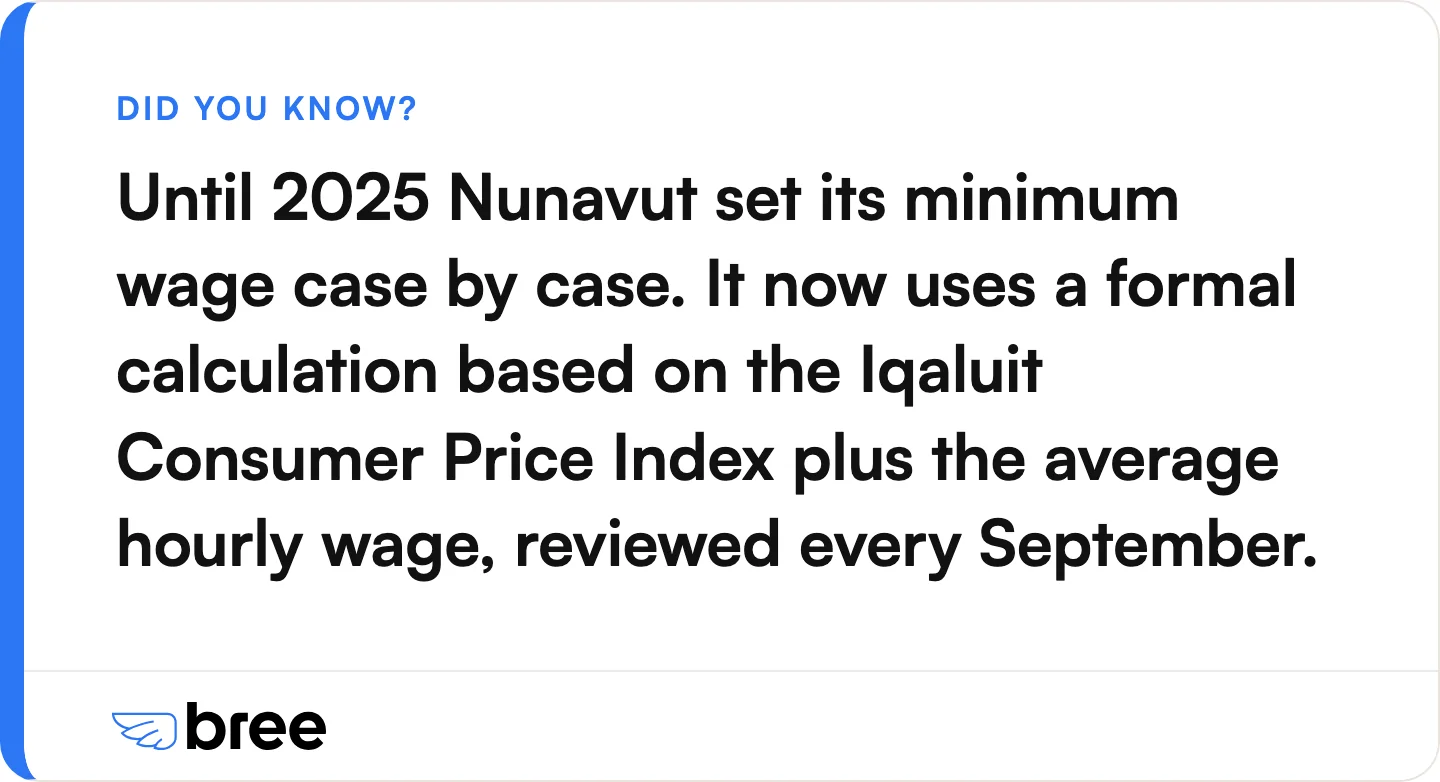
Nunavut shows how these formulas change. Until 2025 the territory set its rate case by case. It now uses a formal calculation based on the Iqaluit Consumer Price Index plus the average hourly wage, reviewed every September, which is part of how it jumped to the top of the national table. Nova Scotia's formula is written into regulation as CPI plus one percentage point, per the Nova Scotia minimum wage order.
Minimum Wage vs Living Wage: The Real Gap
A living wage is what a household actually needs to cover basic costs like rent, food, and transit in a specific community, calculated by regional living-wage networks. In most Canadian cities it sits well above the legal minimum. In Metro Vancouver the 2025 living wage is $27.85 an hour, roughly $10 more than British Columbia's $18.25 minimum.
Living-wage figures are calculated on a household budget, often assuming about 35 hours of work a week, so they measure need rather than the legal floor. Ontario figures come from the Ontario Living Wage Network, and British Columbia figures from Living Wage for Families BC. The Calgary and Edmonton rates were reported by Global News.
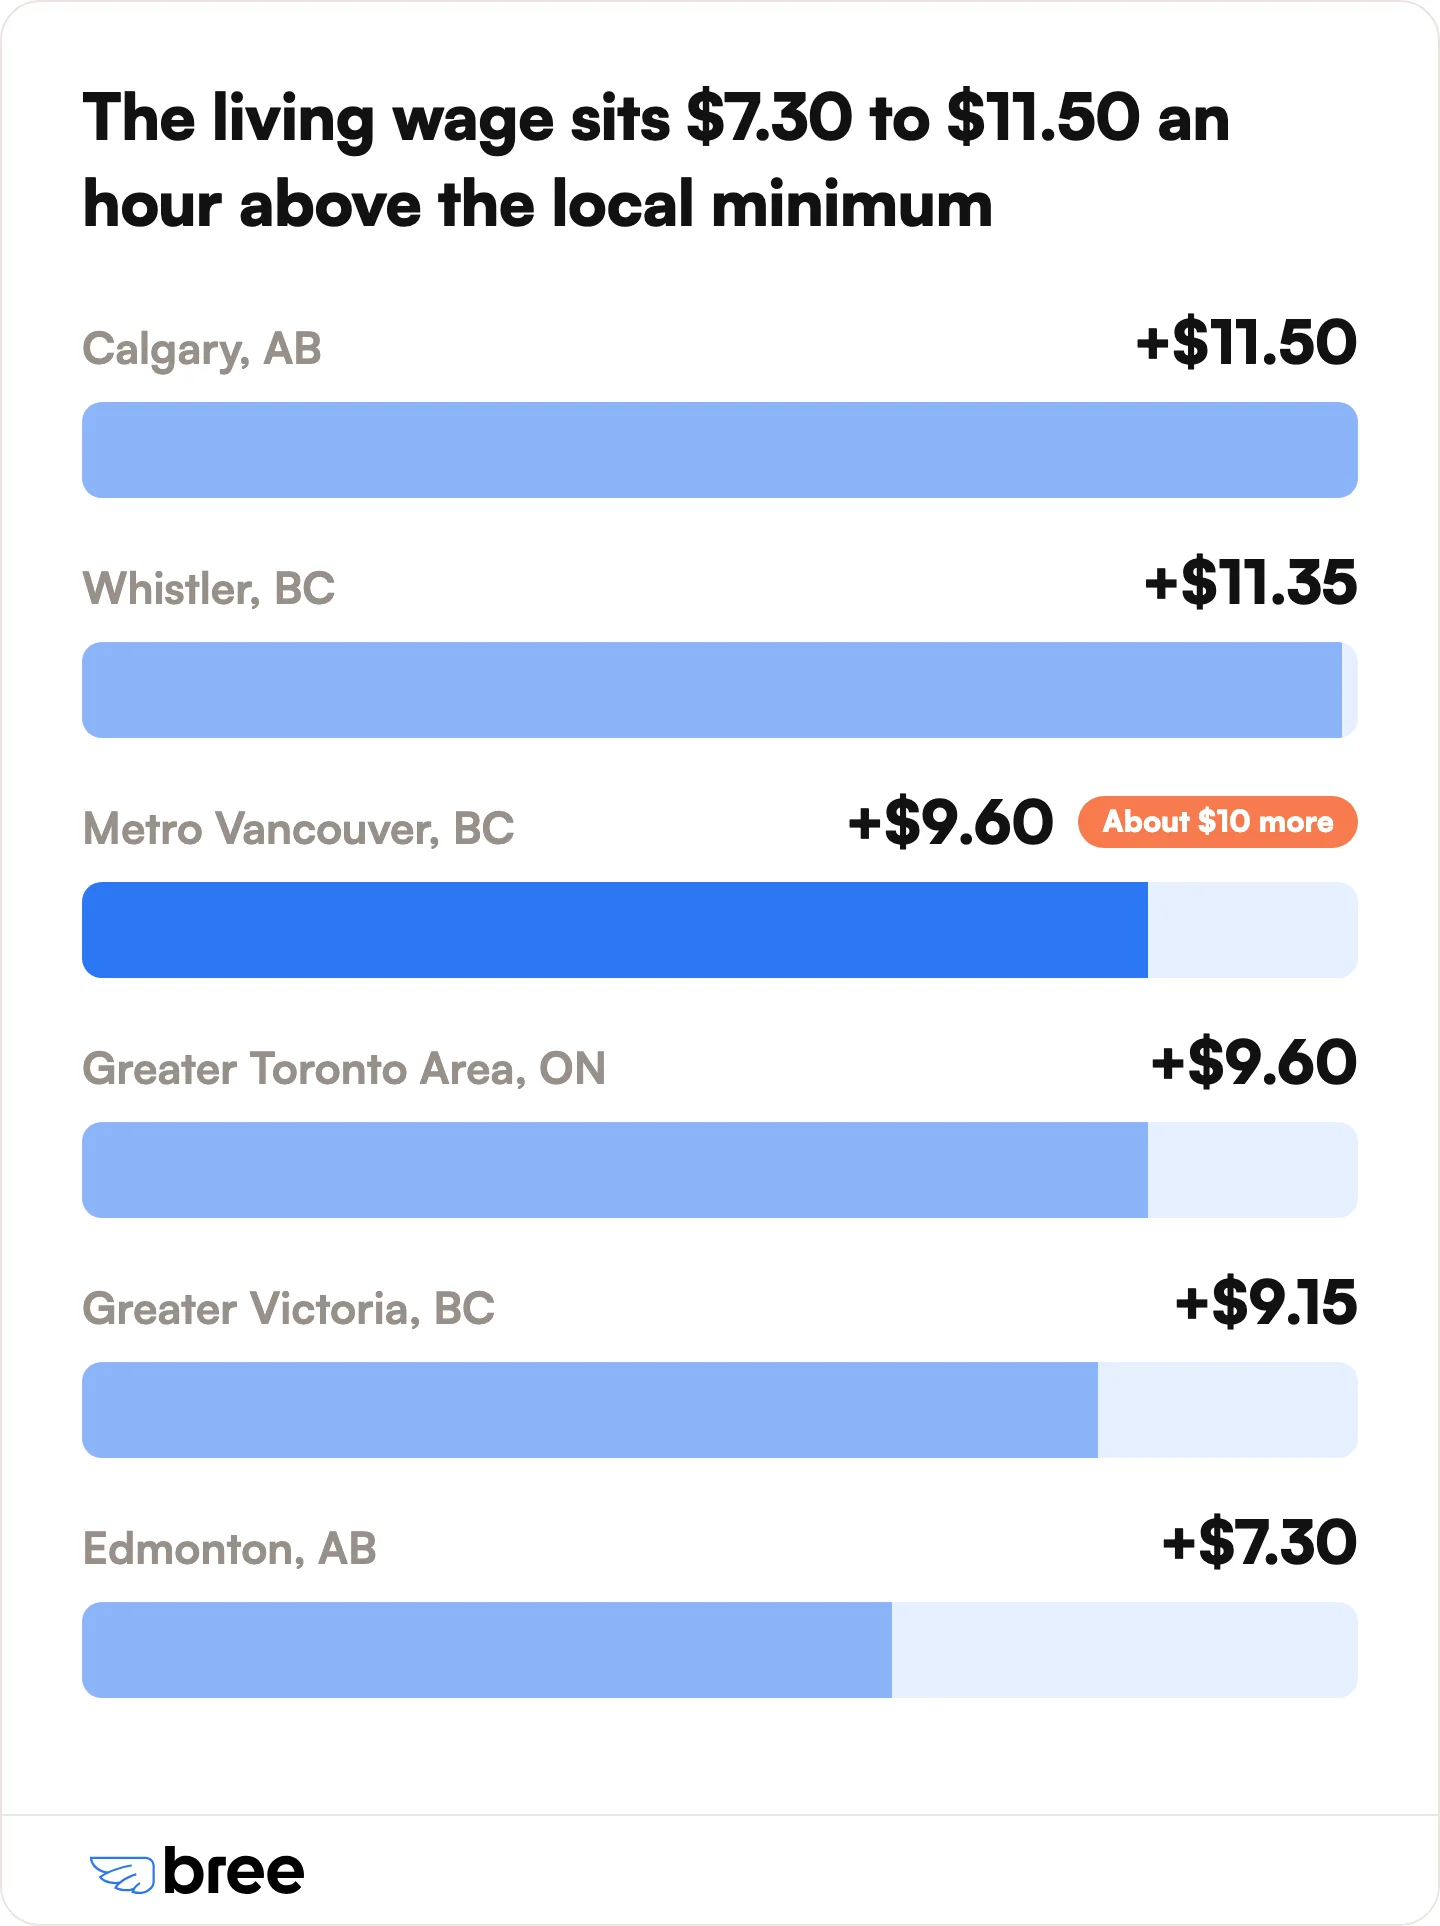
The scale of the gap is not limited to a few cities. Roughly 1 in 3 British Columbia workers earn less than a living wage, according to research reported by CBC, and advocates note there is effectively nowhere in the country where a single person can cover all their costs on full-time minimum-wage pay. See our Canadians living paycheque to paycheque statistics for more on that pressure.
What Minimum Wage Actually Pays Per Year
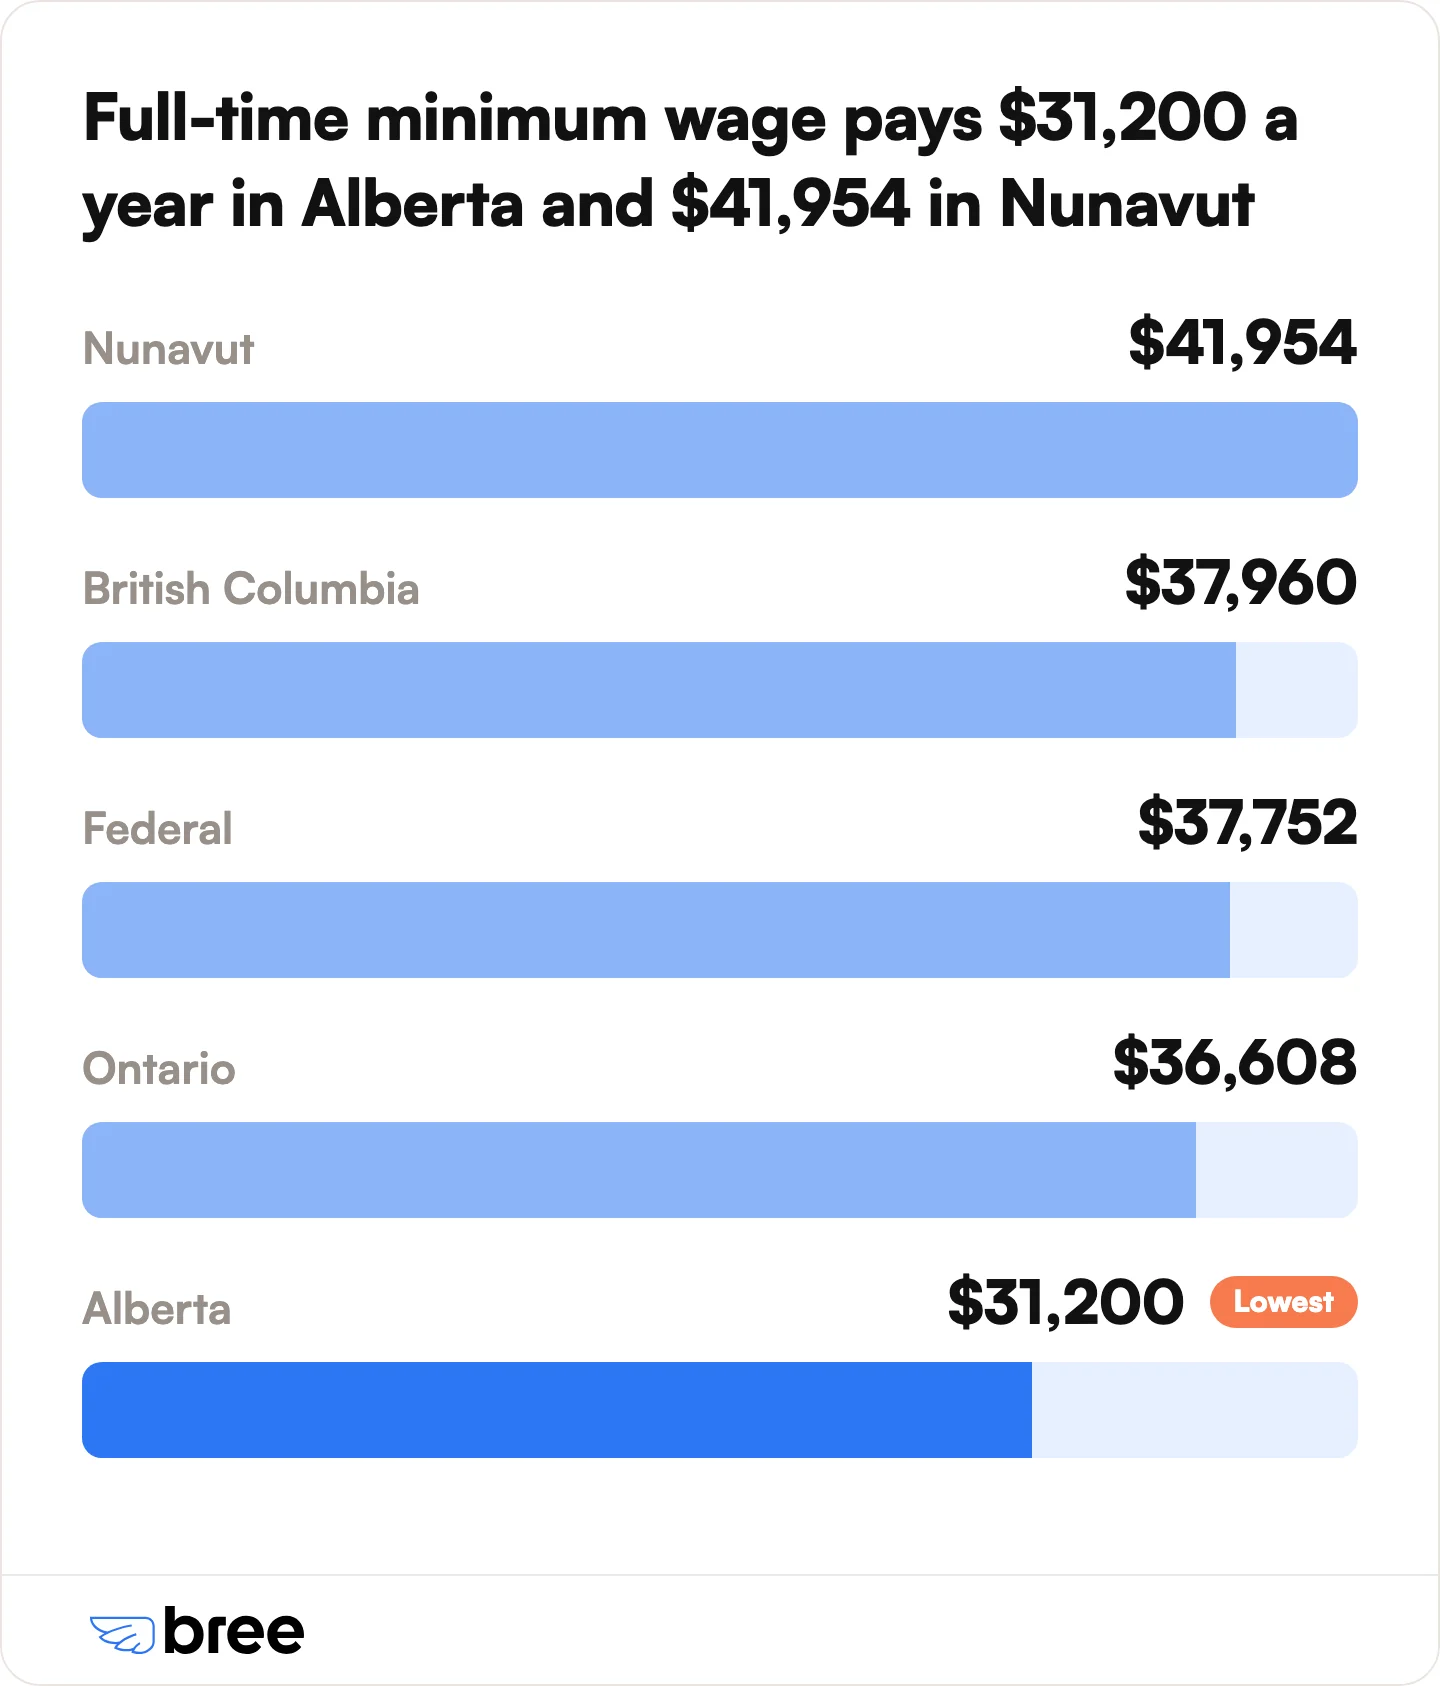
Full-time minimum wage pays between about $31,200 a year in Alberta and $41,954 a year in Nunavut, before tax and deductions. These figures use a standard full-time schedule of 40 hours a week across 52 weeks, which works out to 2,080 paid hours a year, multiplied by the hourly rate.
One caution when comparing these annual numbers to the living wage: living-wage calculators usually assume around 35 hours a week, not 40, so their annual figures rest on fewer hours. The hourly comparison against the living wage is the cleaner one.
How Minimum Wage Compares to the Poverty Line
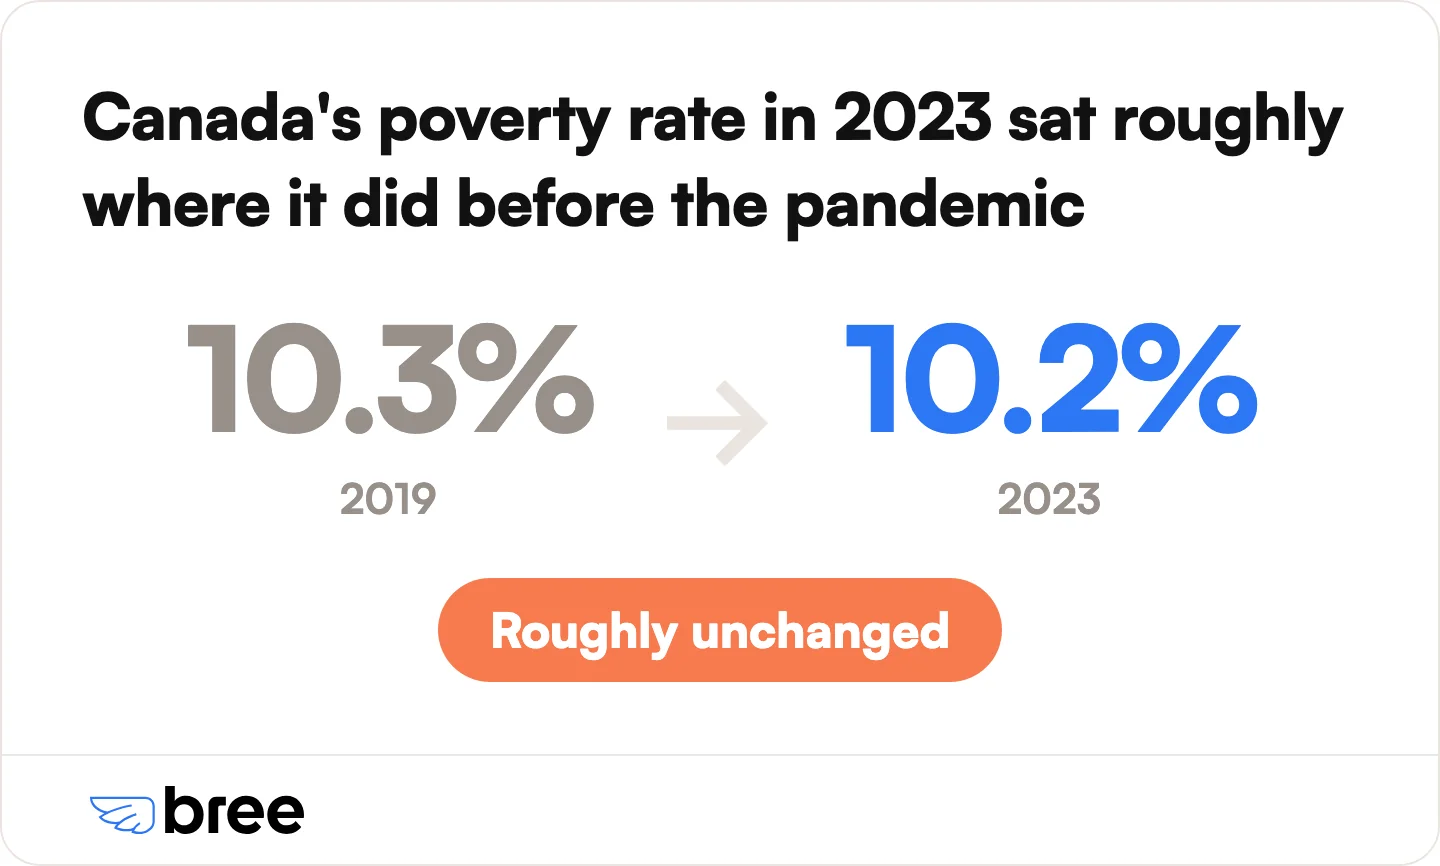
Canada's Official Poverty Line is the Market Basket Measure (MBM), the cost of a basket of food, clothing, shelter, transportation, and other essentials a family needs for a modest standard of living. Canada's official poverty rate was 10.2% in 2023, according to Statistics Canada, roughly where it sat before the pandemic.
The MBM threshold is set for a reference family of two adults and two children, so it is not a direct measure of what a single person needs. The comparison still shows the pressure. A single full-time minimum-wage income of roughly $31,200 to $41,954 a year, depending on the province, leaves little cushion once a household adds children, which is why full-time minimum-wage work does not reliably lift a family above the poverty line.
Student and Youth Minimum Wage Rates
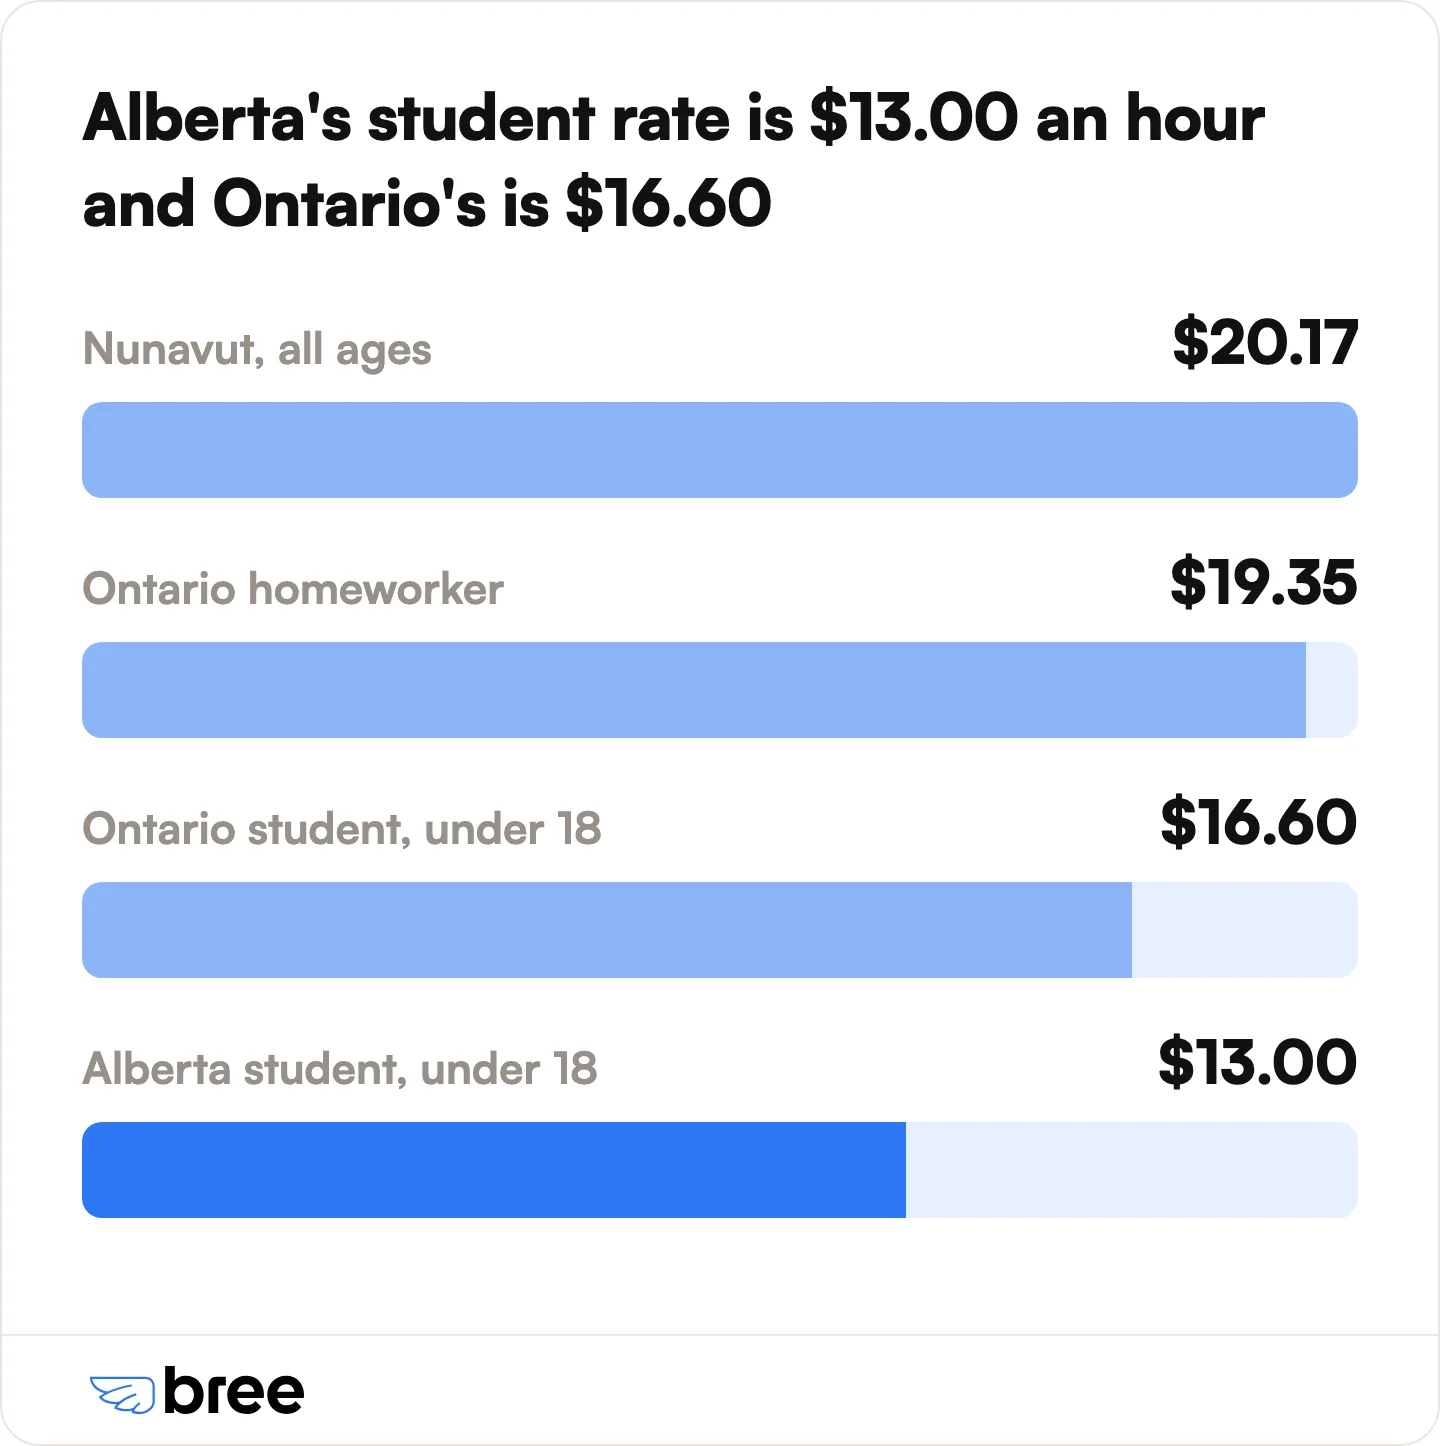
Two provinces set a lower minimum wage for students under 18: Alberta at $13.00 an hour and Ontario at $16.60 an hour. Most jurisdictions apply a single rate to all workers regardless of age.
Alberta's student rate applies only during the school year and only to the first 28 hours worked in a week. Above that, the general rate applies.
Stretching a Minimum-Wage Paycheque
When the legal minimum trails the cost of living in most cities, the space between paycheques gets tight, and the numbers on household finances show it. Canadian household debt reached 179.6% of disposable income in the first quarter of 2026, and the household saving rate fell to 3.5%, its lowest since early 2024, according to Statistics Canada.
That squeeze pushes people toward costly short-term borrowing. A payday loan costs $14 for every $100 borrowed, about 365% a year, per the Financial Consumer Agency of Canada. Borrowing $300 for two weeks costs about $42.00 by payday loan, against $5.92 on a bank line of credit, the agency's own cost comparison shows. There is some relief on bank charges: a new $10 cap on NSF fees, down from as high as $50, took effect on March 12, 2026, per the Department of Finance Canada.
This is where we come in. Unlike a bank line of credit that charges interest, Bree is an interest-free line of credit of up to $750 for Canadians who need to cover a gap between paycheques, with no credit check, no interest, and no mandatory fees, and it accepts government benefits like ODSP, Ontario Works, CPP, the Canada Child Benefit, and EI as income. Funds arrive by direct deposit to your bank account, and you repay on your own schedule. More than 600,000 Canadians use it, with a Trustpilot rating of 4.8 out of 5. For the fuller cost picture, see our guides on consumer debt in Canada and building an emergency fund, or how minimum wage ties into payday lending costs across provinces.
Frequently Asked Questions
Which province has the highest minimum wage?
British Columbia has the highest provincial minimum wage in Canada at $18.25 an hour as of September 2026. Across all jurisdictions, Nunavut is highest at $20.17 an hour, followed by Yukon at $18.51.
Which province has the lowest minimum wage?
Alberta has the lowest minimum wage in Canada at $15.00 an hour, frozen at that rate since October 2018. Saskatchewan is next lowest at $15.35 an hour.
What is the federal minimum wage in Canada?
The federal minimum wage is $18.15 an hour, effective April 1, 2026. It applies only to workers in federally regulated industries such as banks, airlines, railways, and telecommunications. Most Canadian workers are covered by their own province's minimum wage instead.
Will the minimum wage go up in 2026?
Yes. Ontario, Manitoba, Nova Scotia, Prince Edward Island, and Saskatchewan all raise their minimum wage on October 1, 2026. Because most provinces and the federal government index the rate to inflation, further increases follow automatically each year.
Is $27 an hour a living wage in Canada?
In many cities, $27 an hour is close to the living wage. It roughly matches the 2025 living wage in the Greater Toronto Area ($27.20) and Metro Vancouver ($27.85), and it still falls below the living wage in higher-cost areas like Whistler ($29.60).
The Bottom Line
Minimum wage in Canada is a moving target that varies from $15.00 an hour in Alberta to $20.17 in Nunavut, and most jurisdictions now nudge their rate up with inflation every year. But even after a decade of increases, the legal minimum still trails the living wage in nearly every major city, which is why a full-time minimum-wage paycheque can leave a household short before the next one arrives.
That gap between what minimum wage pays and what living actually costs is why we built Bree, an interest-free line of credit of up to $750 for the millions of Canadians living paycheque to paycheque. There is no credit check, no interest, and government benefits count as income, which is why more than 600,000 Canadians rely on it. If a short-term gap is the problem, you can see how a $750 line of credit works without the 365% cost of a payday loan.
Sources
- Employment and Social Development Canada: Federal Minimum Wage
- Employment and Social Development Canada: Minimum Wage Database
- Employment and Social Development Canada: Current and Forthcoming Minimum Wage Rates
- Government of Ontario: Minimum Wage
- Government of British Columbia: Minimum Wage
- Government of Alberta: Minimum Wage
- Government of Saskatchewan: Minimum Wage
- Government of Manitoba: Employment Standards
- Government of Nova Scotia: Minimum Wage
- Government of Nova Scotia: Minimum Wage Order
- Government of Prince Edward Island: Minimum Wage
- Government of Newfoundland and Labrador
- Government of the Northwest Territories: Minimum Wage
- Government of Nunavut
- Ontario Living Wage Network
- Living Wage for Families BC
- Global News: Calgary Living Wage
- CBC: British Columbia Living Wage
- Statistics Canada: Canadian Income Survey and the Market Basket Measure
- Statistics Canada: Household Debt and Savings
- Financial Consumer Agency of Canada: Payday Loans
- Financial Consumer Agency of Canada: Understanding Payday Loans
- Department of Finance Canada: NSF Fee Cap

Join our newsletter to get the latest updates